What Is Hard Water and Why Should Montanans Care About It?
Do you know if your Montana home has hard water? If it does, you may be unknowingly clogging your pipes and irritating your skin. If you don't know what hard water is, you've definitely felt the difference between hard and soft water. But, why should Montanans care about their home's water hardness? Let me explain.
What is hard water, anyway?
Most water in homes has some trace of magnesium and calcium dissolved in it from rock formations giving off the minerals after it rains. The more of those minerals are in your water, the harder it is.
The ideal water hardness is somewhere between 0 and 3.5 grains per gallon (GPG). However, if your water is over 7 GPG, which funny enough is Billings' average GPG, you may experience some symptoms such as dry skin and itchiness, as well as seeing mineral buildup on faucets and showerheads.
Does Montana have a history of hard water?
Only four larger cities in Montana have water hardness under 7 GPG, those being Cut Bank, Bozeman, Butte, and Helena. According to HydroFlow USA, Montana's water is slightly hard, with an average hardness of around 5 GPG.
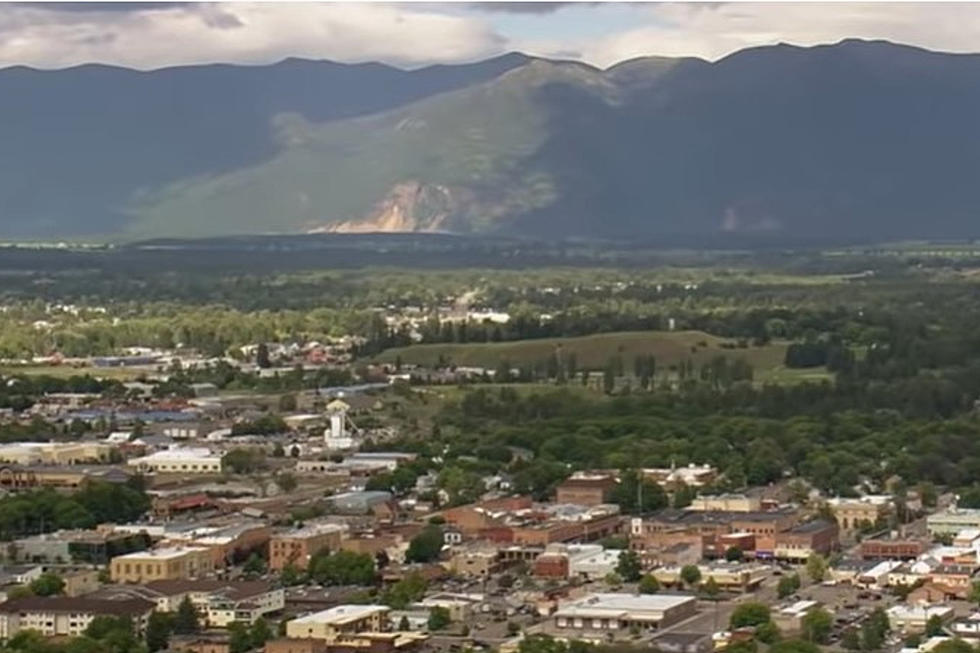
The city with the hardest water in Montana is Kalispell, with an average hardness of 12 GPG. If you live in the Flathead, we hope you have plenty of water softeners in your home. The city with the least hard water in Montana is Helena, whose water only clocks an average hardness of 1 GPG.

In short, it's important to know exactly how to fix hard water issues in your home. Otherwise, it could lead to a house that you won't be able to keep clean and irritated and dry skin. Perhaps invest in a water softener if you'd like to avoid these issues, but be prepared to pay somewhere over $1,000.
READ ON: See the States Where People Live the Longest
LOOK: The most expensive weather and climate disasters in recent decades
More From Cat Country 102.9


